In the AnswerGenius Report, you can find information on the total number of questions your readers submitted to the AnswerGenius chat, the percentage of answered questions, as well as a lot of other useful information, like the exact user queries.
To open the report, navigate to Reports → ClickHelp AI → AnswerGenius Report.
Report Page Structure
Header
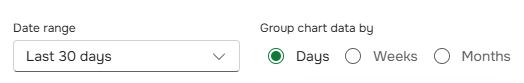
Date range. Allows you to specify the time period for which you want the report to be displayed.
Group chart data by. Allows you to select how the data will be grouped in the charts below.
Metrics

- Total Questions — the number of user messages to AnswerGenius for the selected period.
-
Success Rate — the percentage of successfully answered queries.
Events with status Unknown are excluded from the calculation, although their count is displayed in the tooltip (if there are any in the current date range). - Avg. queries per chat — the average number of user messages per chat (including single message chats).
- Unique users — the number of unique users.
Charts
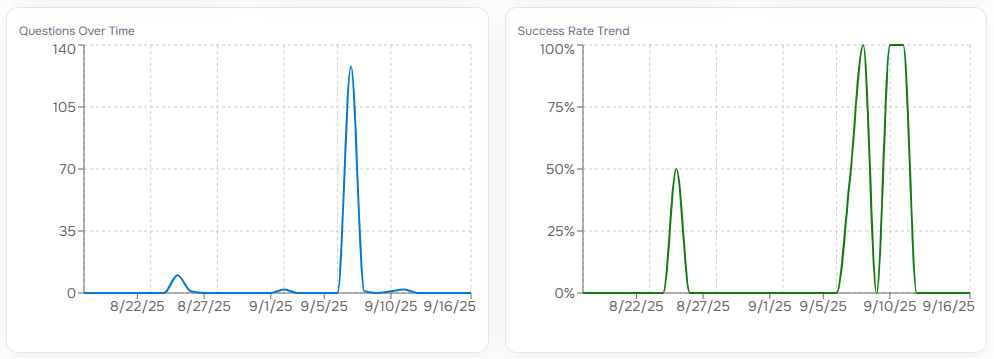
Questions Over Time. Displays the number of questions per day/week/month.
Success Rate Trend. Displays the success rate value per day/week/month.
Events Grid
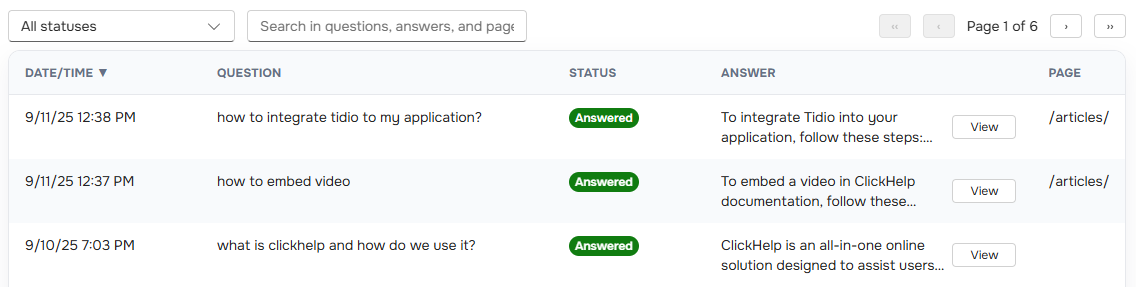
You can control the grid using the following options:
- Status filter. Allows you to filter the grid to show only answered, only unanswered, or all questions.
- Search filter. Allows you to search for occurrences of a specific word or phrase in the Page, Answer, and Question columns.
- Pagination. Commonly used control to scroll between the grid pages.
The grid contains the following columns:
- Date/Time. The date and time of the event according to your time zone.
-
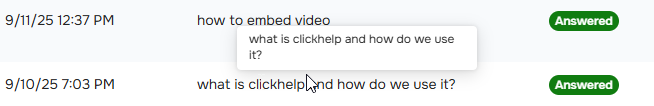
Question. Text of the user's question. It can be truncated in the grid, but you can view the whole question using the tooltip.
- Status. Indicates whether AnswerGenius successfully answered the question or not.
-
Answer. The answer to the user's question. It can be truncated in the grid, but you can view the whole answer using the View button.

- Page. The page from which the question was sent.
Common Scenarios
Here are a few common scenarios to help you quickly get value from the AnswerGenius Report:
-
Find unanswered questions from the past week
Set the date range to Last 7 days and apply the Status = Unanswered filter. This will give you a list of recent queries that AnswerGenius could not resolve. -
Search for questions about a specific term
Use the Search field with this term. This shows you all related queries and responses. -
Check how a publication performs
Enter the publication name in the Search field to view events from that publication. Combine this with the Status filter to analyze unanswered questions in context. -
Evaluate AnswerGenius' success trends
View the Success Rate Trend chart and switch Time grouping to Weeks or Months to see how the answer quality changes over time.
For more advanced scenarios and best practices, see AnswerGenius Report Use Cases.