Want to know how readers interact with your content? The Topic Views and Ratings report shows you the number of topic views, along with positive and negative feedback from readers.
This article explains how to access the report and interpret its data.
Where to find the report
To access the Topic Views and Ratings report, click Reports in the left-hand navigation panel.
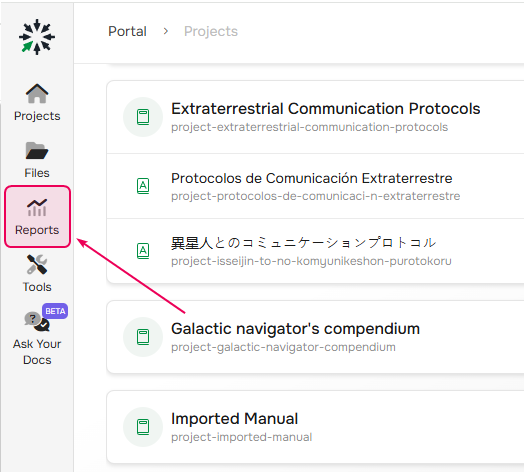
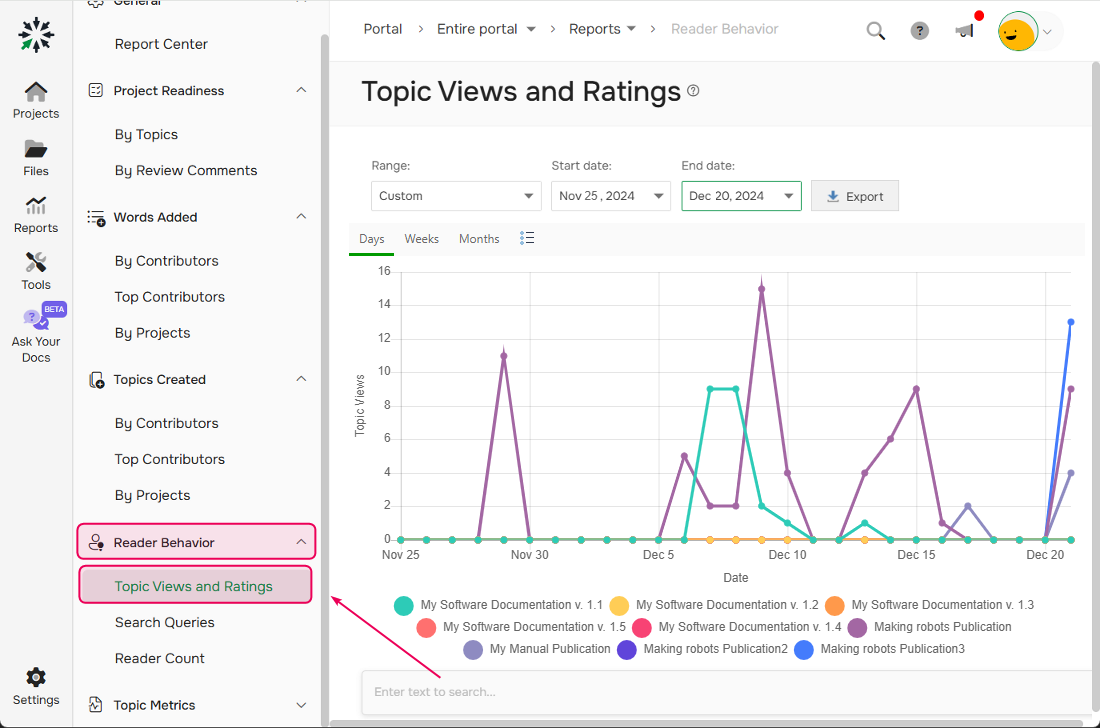
Then, on the Report Center page, select Reader Behavior → Topics Views and Ratings.
What the report includes
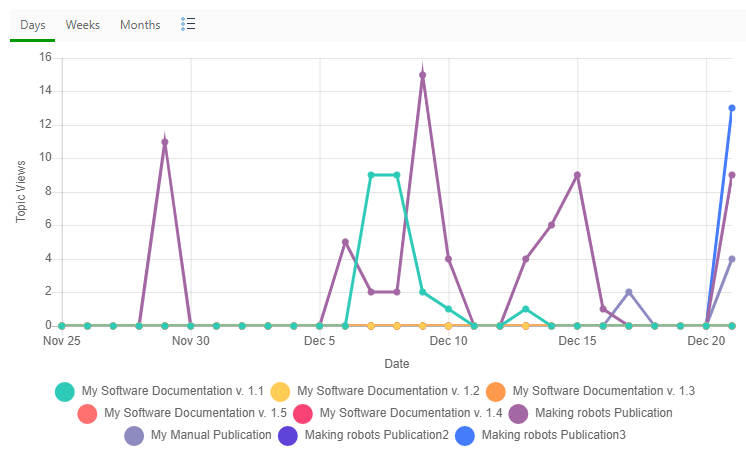
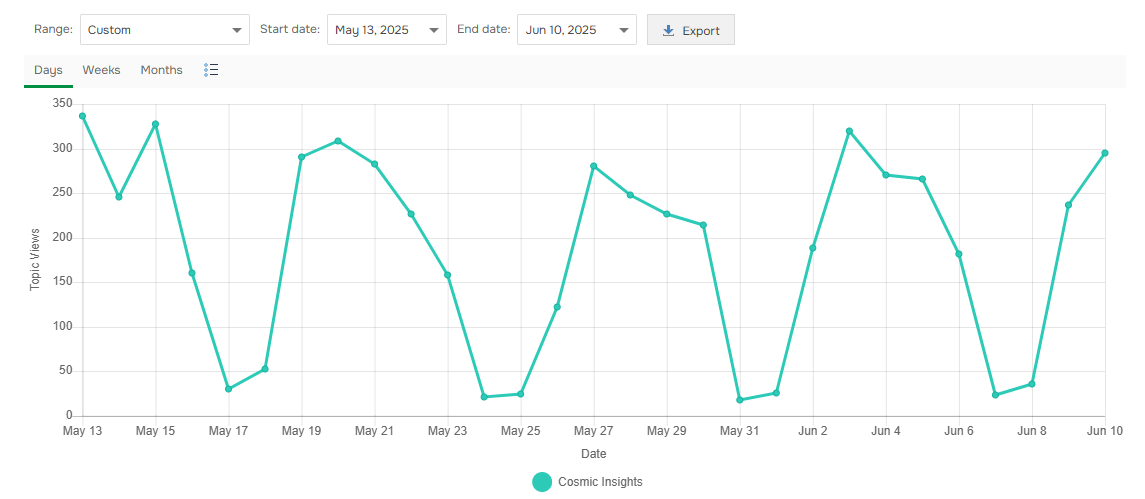
First, in the report you will find a chart showing the number of Topic Views.
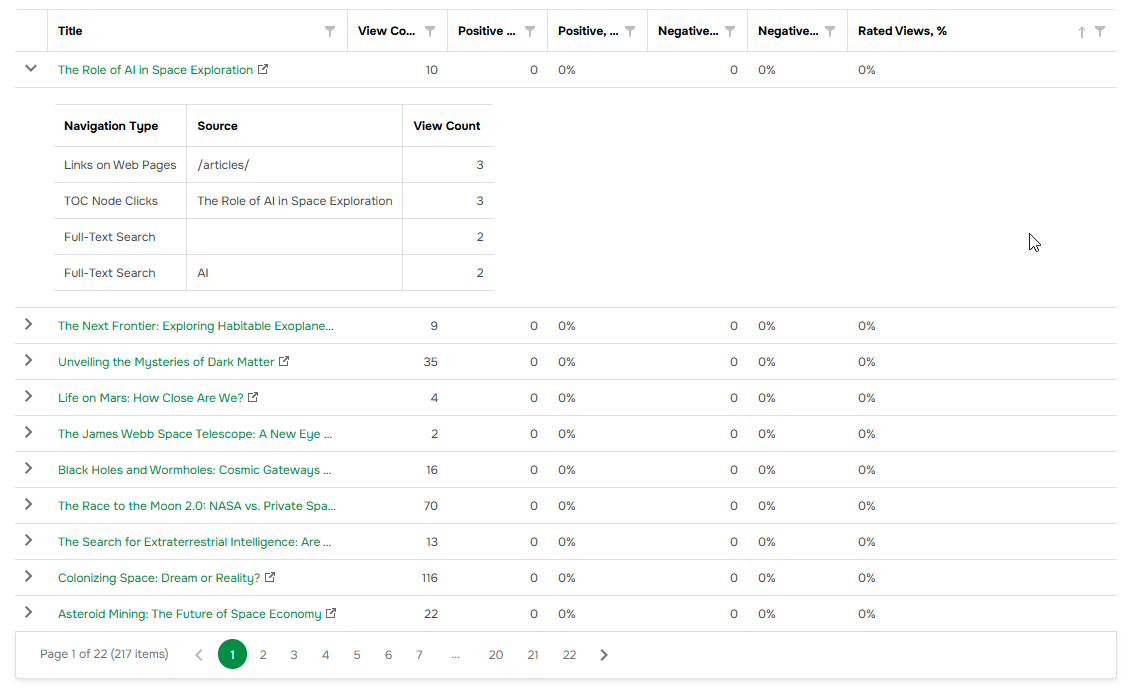
There is also a data table below the chart with detailed metrics. Here is what it looks like:
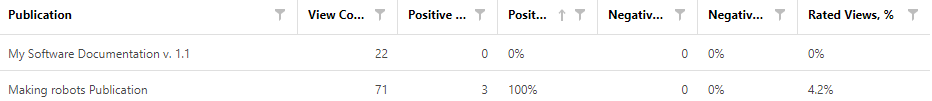
Each column in the table provides insights into reader behavior:
- View Count — number of times a topic was viewed in a specific publication.
- Positive Ratings — number of clicks on the “Yes” button in the reader feedback widget.
- Positive, % — percentage of the "Yes" button clicks as a fraction of the total number of votes.
- Negative Ratings — number of clicks on the “No” button.
- Negative, % — percentage of the "No" button clicks as a fraction of the total number of votes.
- Rated Views, % — percentage of the views when a reader clicked "Yes" or "No" as a fraction of the total number of views. The system doesn't count bots and contributor views, only readers are taken into account.
You can group, sort, and filter the table content to analyze data more effectively. Learn more here: Working with Data Tables.
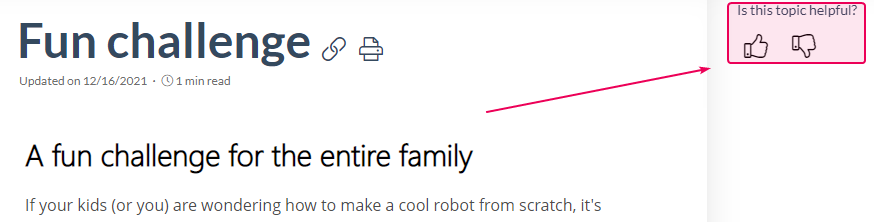
Positive and Negative Ratings
How does your publication get positive and negative ratings? If there is a reader feedback widget enabled in the Reader feedback settings, users can click Yes or No buttons (depends on a ReaderUI template) to indicate whether a topic is useful.
Viewing data by topics
If you’d like to see statistics on a certain topic, choose the right publication from the dropdown at the top of the report.
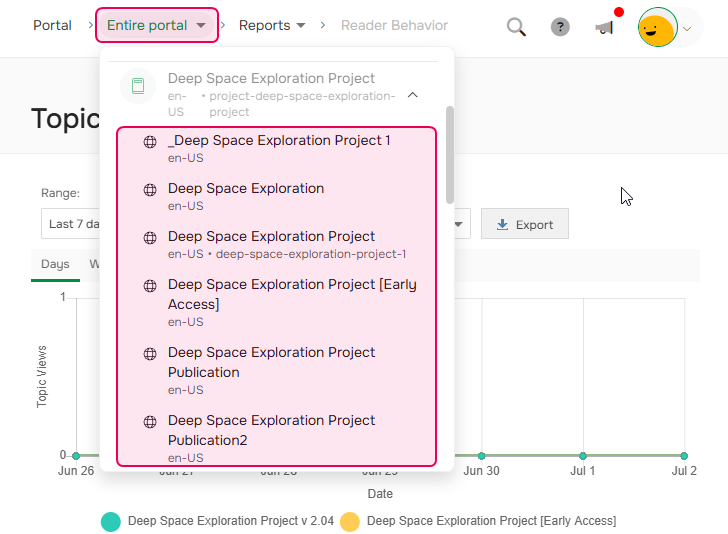
Once selected, all data on the page will relate to that specific publication. The chart will show view trends over time.
And the data table under the chart will show statistics on specific topics.